전체코드 ↓
using System;
using System.Drawing;
using System.IO.Ports; //SerialPort 사용하려면 추가
using System.Windows.Forms;
using System.Windows.Forms.DataVisualization.Charting;

namespace _024_SensorMonitoring
{
    public partial class Form1 : Form
    {//private 를 앞에 쓰면 class내에서만 사용가능
        SerialPort sPort = null;
        int xCount = 100; //차트에 표시되는 데이터 갯수
        //시뮬에서 사용
        Timer t = new Timer();
        Random r = new Random();
        bool simulationFlag = false;
        public Form1()
        {
            InitializeComponent();
            foreach (var port in SerialPort.GetPortNames())
                cb_Port.Items.Add(port);
            cb_Port.Text = "Select Port";
            progressBar1.Minimum = 0; //최소 값
            progressBar1.Maximum = 1023; //최대 값
            //progressBar1.Value = 100; //값지정

            ChartSetting();
            InitSetting();
        }
        private void ChartSetting()
        {
            chart1.Titles.Add("조도");//첫번째 그래프
            chart2.Titles.Add("온도/습도");//두번째 그래프

            chart1.Series.Clear();
            chart1.Series.Add("lumi");
            //1차트 x
            chart1.ChartAreas[0].AxisX.Minimum = 0;
            chart1.ChartAreas[0].AxisX.Maximum = xCount;
            chart1.ChartAreas[0].AxisX.Interval = xCount / 4;
            chart1.ChartAreas[0].AxisX.MajorGrid.LineColor = Color.Gray;
            chart1.ChartAreas[0].AxisX.MajorGrid.LineDashStyle = ChartDashStyle.Dash;
            chart1.ChartAreas[0].AxisY.Minimum = 0;
            chart1.ChartAreas[0].AxisY.Maximum = 800;
            chart1.ChartAreas[0].AxisY.Interval = 200;
            chart1.ChartAreas[0].AxisY.MajorGrid.LineColor = Color.Gray;
            chart1.ChartAreas[0].AxisY.MajorGrid.LineDashStyle = ChartDashStyle.Dash;
            //1,2 차트 배경
            chart1.ChartAreas[0].BackColor = Color.Black;
            chart2.ChartAreas[0].BackColor = Color.Black;
            //2차트 xy
            chart2.ChartAreas[0].AxisX.Minimum = 0;
            chart2.ChartAreas[0].AxisX.Maximum = xCount;
            chart2.ChartAreas[0].AxisX.Interval = xCount / 4;
            chart2.ChartAreas[0].AxisX.MajorGrid.LineColor = Color.Gray;
            chart2.ChartAreas[0].AxisX.MajorGrid.LineDashStyle = ChartDashStyle.Dash;
            chart2.ChartAreas[0].AxisY.Minimum = 0;
            chart2.ChartAreas[0].AxisY.Maximum = 100;
            chart2.ChartAreas[0].AxisY.Interval = 20;
            chart2.ChartAreas[0].AxisY.MajorGrid.LineColor = Color.Gray;
            chart2.ChartAreas[0].AxisY.MajorGrid.LineDashStyle = ChartDashStyle.Dash;

            chart2.Series.Clear();
            chart2.Series.Add("temp");
            chart2.Series.Add("humi");

            chart1.Series[0].ChartType = SeriesChartType.Line;
            chart1.Series[0].Color = Color.LightGreen;
            chart1.Series[0].BorderWidth = 2;

            chart2.Series[0].ChartType = SeriesChartType.Line;
            chart2.Series[0].Color = Color.LightBlue;
            chart2.Series[0].BorderWidth = 2;
            chart2.Series[1].ChartType = SeriesChartType.Line;
            chart2.Series[1].Color = Color.Orange;
            chart2.Series[1].BorderWidth = 2;
        }
        private void InitSetting()
        {
            this.Text = "Arduino Sensor Monitoring System";
            btn_portValue.BackColor = Color.Blue;
            btn_portValue.ForeColor = Color.White;
            btn_portValue.Text = "온도\n습도\n조도";
            btn_portValue.Font = new Font("맑은고딕", 12, FontStyle.Bold);
            label1.Text = "Connection Time = ";
            txtCount.TextAlign = HorizontalAlignment.Center;
            btnConnect.Enabled = false;
            btnDisconnect.Enabled = false;
        }
        private void 시작ToolStripMenuItem_Click(object sender, EventArgs e)
        {
            simulationFlag = true;
            t.Interval = 1000;
            t.Tick += T_tick;
            t.Start();
        }
        private void T_tick(object sender, EventArgs e)
        {
            int lumi = r.Next(800); //조도 값 랜덤값 Max
            int temp = r.Next(10, 35); //온도값 랜덤 범위
            int humi = r.Next(30, 80); //습도값 랜덤 범위
            string s = string.Format("{0}\t{1}\t{2}", temp, humi, lumi);
            ShowValue(s);
        }
        static int skip = 0; //처음 받음 값 3개를 skip 하기 위함 //static은 고정값
        static int counter = 0; //차트에 표시 영역을 바꾸기 위함
        private void ShowValue(string s)
        {
            listBox1.Items.Add(DateTime.Now.ToString()+"\t>>\t" + s);
            listBox1.SelectedIndex = listBox1.Items.Count - 1;
            if (++skip <= 3)
                return;
            else
                skip = 4;
            counter++;
            txtCount.Text = "counter + " + counter;
            string[] sub = new string[3];
            sub = s.Split('\t');
            int lumi = int.Parse(sub[0]);
            double temp = double.Parse(sub[1]);
            double humi = double.Parse(sub[2]);
            if (simulationFlag = false)
                btn_portValue.Text = sPort.PortName;
            else
                btn_portValue.Text = "Simulation";
            btn_portValue.Text += "\n온도 : " + temp + "cº\n습도 : " + humi + "%\n조도 : " + lumi;
            progressBar1.Value = lumi;
            chart1.Series[0].Points.Add(lumi);
            chart2.Series[0].Points.Add(temp);
            chart2.Series[1].Points.Add(humi);
            //차트에 스크롤 기능 추가
            chart1.ChartAreas[0].AxisX.Minimum = 0;
            chart1.ChartAreas[0].AxisX.Maximum = (counter >= xCount) ? counter : xCount;
            chart2.ChartAreas[0].AxisX.Minimum = 0;
            chart2.ChartAreas[0].AxisX.Maximum = (counter >= xCount) ? counter : xCount;
            if (counter > xCount){
                chart1.ChartAreas[0].AxisX.ScaleView.Zoom(counter - xCount, counter);
                chart2.ChartAreas[0].AxisX.ScaleView.Zoom(counter - xCount, counter);
            }
        }
        private void 끝ToolStripMenuItem_Click(object sender, EventArgs e)
        {
            t.Stop();
        }
        private void cb_Port_SelectedIndexChanged(object sender, EventArgs e)
        {
            ComboBox cb = (ComboBox)sender;
            sPort = new SerialPort(cb.SelectedItem.ToString());
            sPort.Open();
            sPort.DataReceived += SPort_DataReceived;
            label1.Text = "Connection Time :" + DateTime.Now.ToString();
            btnConnect.Enabled = false;
            btnDisconnect.Enabled = true;
        }
        private void SPort_DataReceived(object sender, SerialDataReceivedEventArgs e)
        {
            string s = sPort.ReadLine();
            this.BeginInvoke(new Action(delegate { ShowValue(s); }));
        }
        private void btnDisconnect_Click(object sender, EventArgs e)
        {
            sPort.Close();
            btnConnect.Enabled = true;
            btnDisconnect.Enabled = false;
        }
        private void btnConnect_Click(object sender, EventArgs e)
        {
            sPort.Open();
            skip = 0;
            btnConnect.Enabled = false;
            btnDisconnect.Enabled = true;
        }
    }
}
public partial class Form1 : Form
{//private 를 앞에 쓰면 class내에서만 사용가능
SerialPort sPort = null;
int xCount = 100; //차트에 표시되는 데이터 갯수
//시뮬에서 사용
Timer t = new Timer();
Random r = new Random();
bool simulationFlag = false;SerialPort class는 sPort
Timer class는 t
Random class는 r 선언
차트에 표시될 데이터의 갯수를 int xCount로 선언
시뮬레이션을 실행 여부를 결정하는 bool simulationFlag
    public Form1()
    {
        InitializeComponent();
        foreach (var port in SerialPort.GetPortNames())
            cb_Port.Items.Add(port);
        cb_Port.Text = "Select Port";
        progressBar1.Minimum = 0; //최소 값
        progressBar1.Maximum = 1023; //최대 값
        //progressBar1.Value = 100; //값지정

        ChartSetting();
        InitSetting();
    }
콤보 박스에 현재 있는 연결된 port를 SerialPort.GetPortNames()로 불러온뒤
port 지역변수를 통해 foreach로 콤보박스의 item에 추가

위 progressbar 최소값은 0 최대 값은 1023
        private void ChartSetting()
        {
            chart1.Titles.Add("조도");//첫번째 그래프
            chart2.Titles.Add("온도/습도");//두번째 그래프

            chart1.Series.Clear();
            chart1.Series.Add("lumi");
            //1차트 x
            chart1.ChartAreas[0].AxisX.Minimum = 0;
            chart1.ChartAreas[0].AxisX.Maximum = xCount;
            chart1.ChartAreas[0].AxisX.Interval = xCount / 4;
            chart1.ChartAreas[0].AxisX.MajorGrid.LineColor = Color.Gray;
            chart1.ChartAreas[0].AxisX.MajorGrid.LineDashStyle = ChartDashStyle.Dash;
            chart1.ChartAreas[0].AxisY.Minimum = 0;
            chart1.ChartAreas[0].AxisY.Maximum = 800;
            chart1.ChartAreas[0].AxisY.Interval = 200;
            chart1.ChartAreas[0].AxisY.MajorGrid.LineColor = Color.Gray;
            chart1.ChartAreas[0].AxisY.MajorGrid.LineDashStyle = ChartDashStyle.Dash;
            //1,2 차트 배경
            chart1.ChartAreas[0].BackColor = Color.Black;
            chart2.ChartAreas[0].BackColor = Color.Black;
            //2차트 xy
            chart2.ChartAreas[0].AxisX.Minimum = 0;
            chart2.ChartAreas[0].AxisX.Maximum = xCount;
            chart2.ChartAreas[0].AxisX.Interval = xCount / 4;
            chart2.ChartAreas[0].AxisX.MajorGrid.LineColor = Color.Gray;
            chart2.ChartAreas[0].AxisX.MajorGrid.LineDashStyle = ChartDashStyle.Dash;
            chart2.ChartAreas[0].AxisY.Minimum = 0;
            chart2.ChartAreas[0].AxisY.Maximum = 100;
            chart2.ChartAreas[0].AxisY.Interval = 20;
            chart2.ChartAreas[0].AxisY.MajorGrid.LineColor = Color.Gray;
            chart2.ChartAreas[0].AxisY.MajorGrid.LineDashStyle = ChartDashStyle.Dash;

            chart2.Series.Clear();
            chart2.Series.Add("temp");
            chart2.Series.Add("humi");

            chart1.Series[0].ChartType = SeriesChartType.Line;
            chart1.Series[0].Color = Color.LightGreen;
            chart1.Series[0].BorderWidth = 2;

            chart2.Series[0].ChartType = SeriesChartType.Line;
            chart2.Series[0].Color = Color.LightBlue;
            chart2.Series[0].BorderWidth = 2;
            chart2.Series[1].ChartType = SeriesChartType.Line;
            chart2.Series[1].Color = Color.Orange;
            chart2.Series[1].BorderWidth = 2;
        }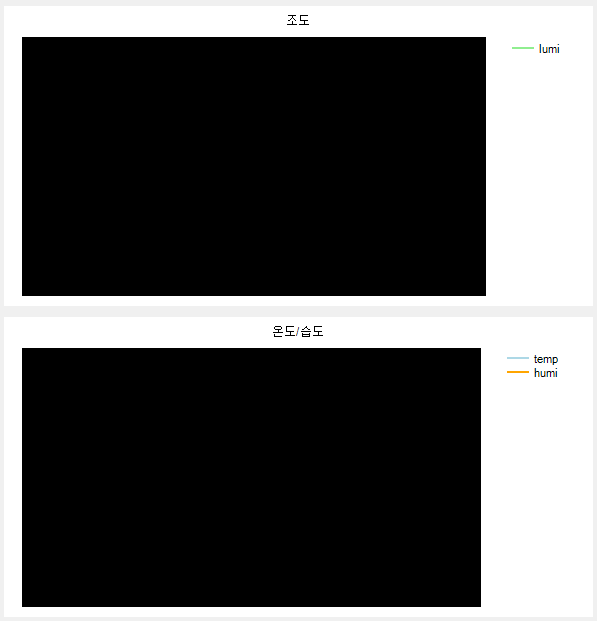
차트는 위와 같이 설정
설명은 생략
        private void InitSetting()
        {
            this.Text = "Arduino Sensor Monitoring System";
            btn_portValue.BackColor = Color.Blue;
            btn_portValue.ForeColor = Color.White;
            btn_portValue.Text = "온도\n습도\n조도";
            btn_portValue.Font = new Font("맑은고딕", 12, FontStyle.Bold);
            label1.Text = "Connection Time = ";
            txtCount.TextAlign = HorizontalAlignment.Center;
            btnConnect.Enabled = false;
            btnDisconnect.Enabled = false;
        }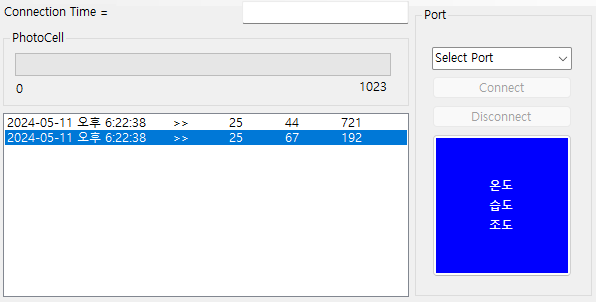
위 레이아웃 설정
private void 시작ToolStripMenuItem_Click(object sender, EventArgs e)
{
    simulationFlag = true;
    t.Interval = 1000;
    t.Tick += T_tick;
    t.Start();
}
bool simulationFlag를 true로 바꾼뒤 Timer 클래스를 실행
T_tick 클래스 실행
private void T_tick(object sender, EventArgs e)
{
    int lumi = r.Next(800); //조도 값 랜덤값 Max
    int temp = r.Next(10, 35); //온도값 랜덤 범위
    int humi = r.Next(30, 80); //습도값 랜덤 범위
    string s = string.Format("{0}\t{1}\t{2}", temp, humi, lumi);
    ShowValue(s);
}
조도값 온도값 습도값 랜덤 실행후
string s 로 저장
showValue 메서드 실행
static int skip = 0; //처음 받음 값 3개를 skip 하기 위함 //static은 고정값
static int counter = 0; //차트에 표시 영역을 바꾸기 위함
private void ShowValue(string s)
{
    listBox1.Items.Add(DateTime.Now.ToString()+"\t>>\t" + s);
listbox에 현재 시간과 위에서 선언한 지역변수 string s를 합하여 추가

listBox1.SelectedIndex = listBox1.Items.Count - 1;바로 위 처럼 파란색으로 선택되게 설정
if (++skip <= 3)
    return;
else
    skip = 4;
skip 값을 1씩 추가해주다가
skip이 3아래면 처음 세번째 값까지는 버리고
그 이후로는 4로 고정
counter++;
txtCount.Text = "counter : " + counter;
.conecting time 오른쪽에 글자 추가
그래프에 하나씩 그려질때 마다 counter 값 1씩 추가
sub = s.Split('\t');
int lumi = int.Parse(sub[0]);
double temp = double.Parse(sub[1]);
double humi = double.Parse(sub[2]);
\t를 통해 나누어진 s를 .Split으로 나눈다.
lumi와 temp와 humi로 나누어 선언
if (simulationFlag == false)
    btn_portValue.Text = sPort.PortName;
else
    btn_portValue.Text = "Simulation";
btn_portValue.Text += "\n온도 : " + temp + "cº\n습도 : " + humi + "%\n조도 : " + lumi;
온도 조도 습도 버튼에 해당 값을 넣어준다.
simulation이면 위에 그 글자가 뜨고
port가 있다면 포트 값을 표시
progressBar1.Value = lumi;
chart1.Series[0].Points.Add(lumi);
chart2.Series[0].Points.Add(temp);
chart2.Series[1].Points.Add(humi);
lumi(조도값)을 맨위 progressBar1에 표시
그리고 차트 값에 각각 추가
//차트에 스크롤 기능 추가
chart1.ChartAreas[0].AxisX.Minimum = 0;
chart1.ChartAreas[0].AxisX.Maximum = (counter >= xCount) ? counter : xCount;
chart2.ChartAreas[0].AxisX.Minimum = 0;
chart2.ChartAreas[0].AxisX.Maximum = (counter >= xCount) ? counter : xCount;
if (counter > xCount){
    chart1.ChartAreas[0].AxisX.ScaleView.Zoom(counter - xCount, counter);
    chart2.ChartAreas[0].AxisX.ScaleView.Zoom(counter - xCount, counter);
}
차트 초기값
아트에 표시된 개수가 xCount값을 넘기면 ScalseView.Zoom을 실행
ScaleView.Zoom(보여질 차트의 처음값, 보여질 차트의 끝값)
X의 최대값이 Counter 값이 xCount값보다 크면 counter 아니면 xCount값 으로 나
private void 끝ToolStripMenuItem_Click(object sender, EventArgs e)
{
    t.Stop();
}
위 끝 버튼 누르면 시뮬레이션 종료
private void cb_Port_SelectedIndexChanged(object sender, EventArgs e)
{
    ComboBox cb = (ComboBox)sender;
    sPort = new SerialPort(cb.SelectedItem.ToString());
    sPort.Open();
    sPort.DataReceived += SPort_DataReceived;
    label1.Text = "Connection Time :" + DateTime.Now.ToString();
    btnConnect.Enabled = false;
    btnDisconnect.Enabled = true;
}
체크박스의 값이 변경되면
데이터 값을 받을때 마다 SPort_DataReceived 메소드 실행
sPort은 새 시리얼 포트 추가

Connection Time 값에 현새 시간 추가
sPort는 시작
connect 버튼 비활성화
disconnect 버튼 활성화
private void SPort_DataReceived(object sender, SerialDataReceivedEventArgs e)
{
    string s = sPort.ReadLine();
    this.BeginInvoke(new Action(delegate { ShowValue(s); }));
}
s값에 sPort값을 받아옴
private void btnDisconnect_Click(object sender, EventArgs e)
{
    sPort.Close();
    btnConnect.Enabled = true;
    btnDisconnect.Enabled = false;
}
Connect 누르면 sPort는 종료
connect 버튼 활성화
disconnect 버튼 비 활성화
        private void btnConnect_Click(object sender, EventArgs e)
        {
            sPort.Open();
            skip = 0;
            btnConnect.Enabled = false;
            btnDisconnect.Enabled = true;
        }
    }
}
Connect 누르면 sPort는 시작
skip 값 초기화
connect 버튼 비활성화
disconnect 버튼 활성화
'C#' 카테고리의 다른 글
| 13주차- SnakeBite (0) | 2024.06.02 |
|---|---|
| 12주차 WPF (0) | 2024.05.25 |
| 9주차-FireBase 완성 (0) | 2024.05.05 |
| 8주차-아날로그 시계(2) / FireBase(1) (0) | 2024.04.23 |
| 6주차-아날로그 시계 만들기(1) (0) | 2024.04.14 |


